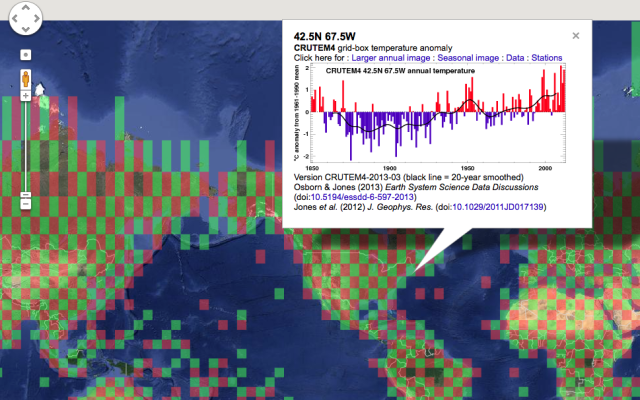
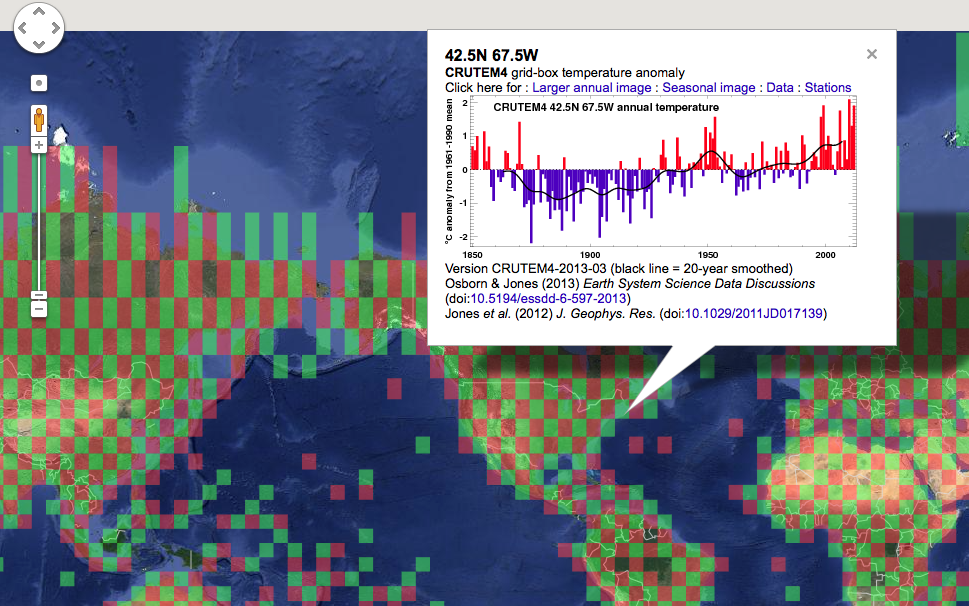
In an interesting bit of geotagging, the University of East Anglia's Climatic Research Unit has placed its global temperature data on Google Maps. The data set, called CRUTEM4, tracks how the temperatures at the Earth's surface have changed over the last century or so (ocean data is handled by a different project and is not included here). By adding geographic data, it's possible to get a sense of how different regions are responding to our changing climate and where we still lack solid data.
CRUTEM4 calculates what's called a global mean land surface temperature. To do so, it divides the Earth's land areas into equally sized grid squares. Using temperature data from monitoring equipment in each grid cell, an average temperature for the cell is calculated; these temperatures are then averaged across the globe to give a global mean temperature.
These grid cells are displayed in red and green on Google Earth (the color has nothing to do with the temperature trend in the cell). By clicking any one of them, you can bring up a history of the temperatures within that cell. The map also makes it clear that there are lots of areas in the globe with sparse coverage. Antarctica and Greenland only have some scattered readings along its coast; Siberia, the Amazon, and Sahara all lack readings from some spots in their interiors.
For the most part, the individual grid squares roughly parallel the global temperature trends. There are a few exceptions, though, such as a number of sites in the North Atlantic that have relatively short temperature records.
It's possible to download a file that will let you peruse the same data in Google Earth; the CRU has posted instructions for how to do so.
reader comments
26